
IELTS ライティング Task 1 (サンプル問題)
 日本人講師KG
IELTSのWriting Task1には、大きく分けて7つのタイプがあります。下記にはそれぞれのタイプに応じて問題例を分類しています。問いのタイプに応じた自分なりの論の展開(構成)を頭に入れておくと、本番で大きく時間を節約することができます。皆さんの練習に役立てば幸いです。
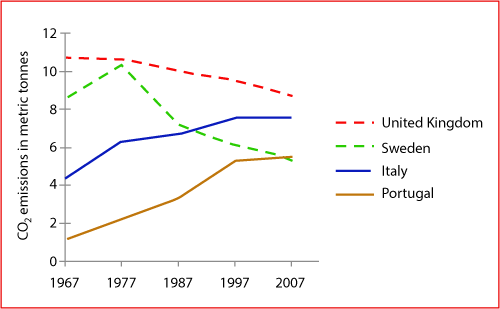
The Graph below shows average carbon dioxide (CO2) emissions per person in the United Kingdom, Sweden, Italy and Portugal between 1967 and 2007. Summarize the information by selecting and reporting the main features, and make comparisons where relevant.
Average carbon dioxide (CO2) emissions per person , 1967-2007
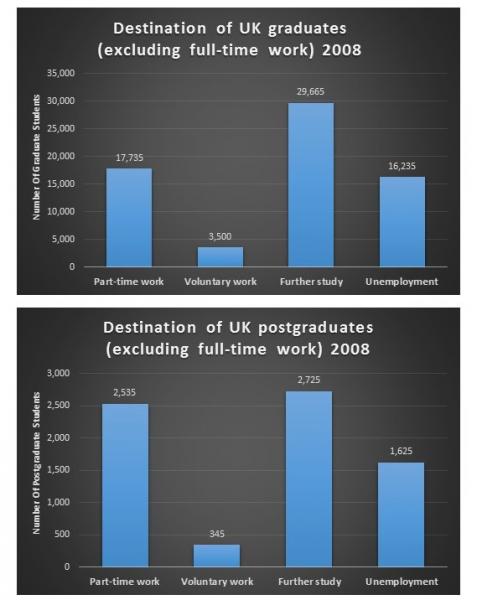
The charts below show what UK graduate and postgraduate students who did not go into full-time work did after leaving college in 2008. Summarize the information by selecting and reporting the main features, and make comparisons where relevant.
The bar chart below shows the percentage of Australian men and women in different age groups who did regular physical activity in 2010. Summarize the information by selecting and reporting the main features, and make comparisons where relevant.

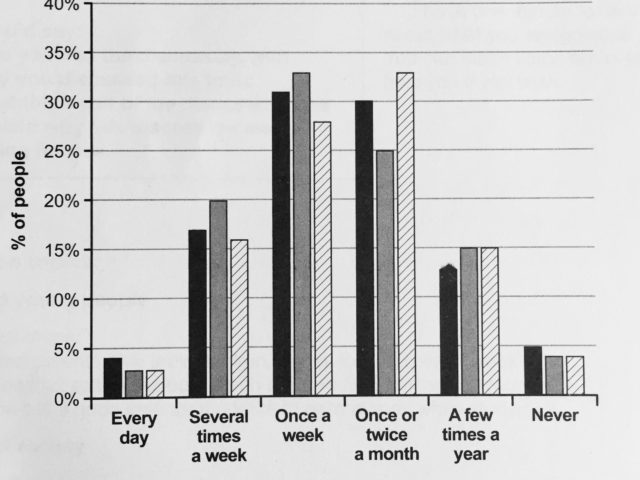
The chart below shows how frequently people in the USA ate at fast food restaurants between 2003 and 2013. Summarize the information by selecting and reporting the main features, and make comparisons where relevant.
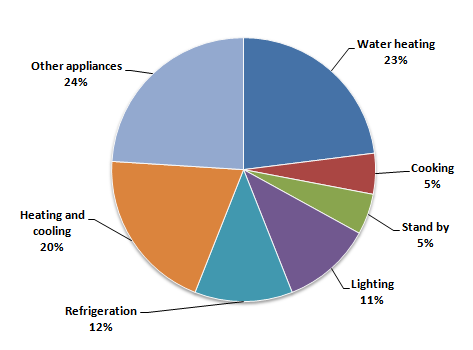
The first chart below shows how energy is used in an average Australian household. The second chart shows the percentage of greenhouse gas emissions which result from this energy use.
The percentage of household energy use in Australia:
The percentage of greenhouse gas produced in Australia:

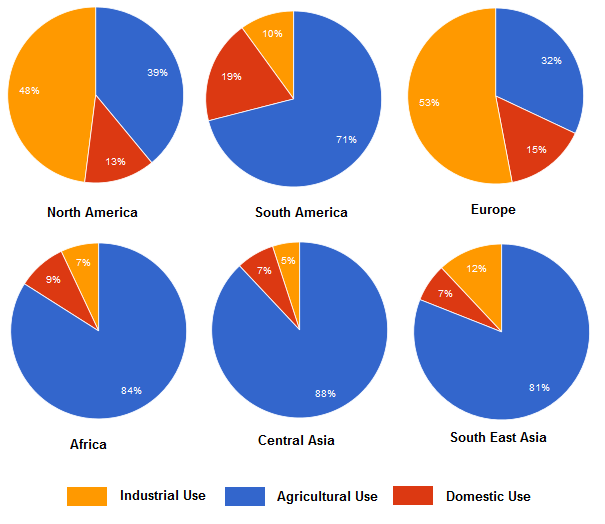
The charts below show the percentage of water used for different purposes in six areas of the world. Summarize the information by selecting and reporting the main features, and make comparisons where relevant.
Percentage of water used for different purposes in six areas of the world.
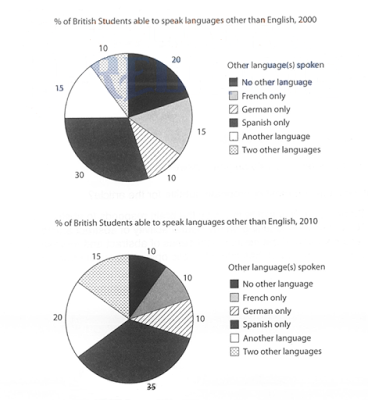
The charts below show the proportions of British students at one university in England who were able to speak other languages in addition to English, in 2000 and 2010. Summarise the information by selecting and reporting the main features, and make comparisons where relevant.
The tables below give information about sales of Fairtrade*-labelled coffee and bananas in 1999 and 2004 in five European countries. Summarize the information by selecting and reporting the main features, and make comparisons where relevant.
Sales of Fairtrade-labelled coffee and bananas (1999 & 2004)

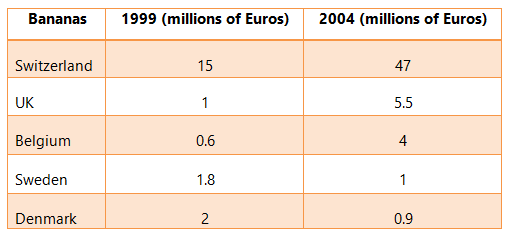
*Fairtrade: a category of products for which farmers from developing countries have been paid an officially agreed fair price.
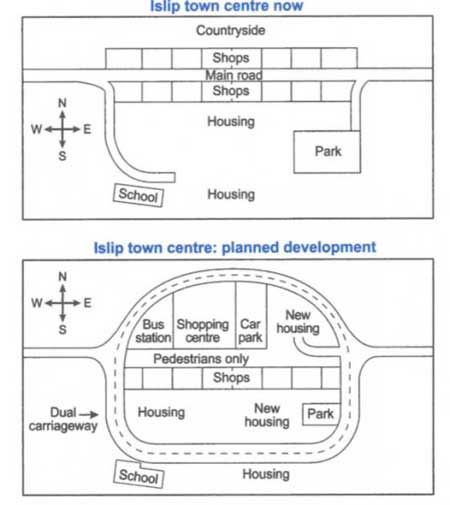
The maps below show the centre of a small town called Islip as it is now, and plans for its development. Summarise the information by selecting and reporting the main features, and make comparisons where relevant.
The diagram below show the life cycle of a species of large fish called the salmon. Summarise the information by selecting and reporting the main features, and make comparisons where relevant.

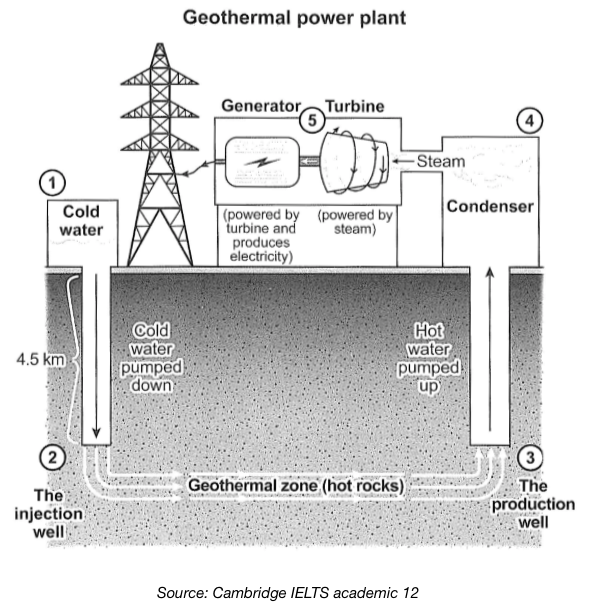
The diagram below shows how geothermal energy is used to produce electricity.Summarize the information by selecting and reporting the main features, and make comparisons where relevant.
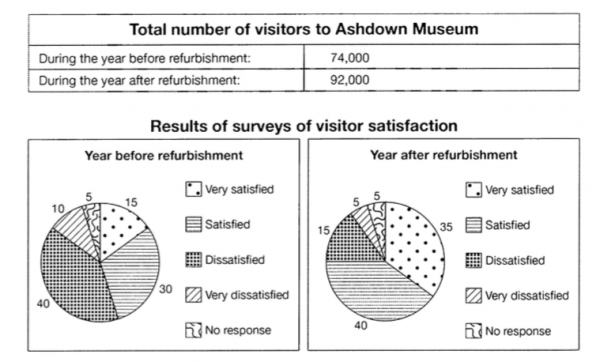
The table below shows the numbers of visitors to Ashdown Museum during the year before and the year after it was refurbished. The charts show the result of surveys asking visitors how satisfied they were with their visit, during the same two periods.
+++++++++++++++++++++++++++++++++++++
当校では2つの無料メルマガを運営しています。
1. フィリピン留学 ブログには書けない話
フィリピン留学の『本当の姿』を知ることができます。
2. 週刊セブ島留学&起業日記
http://cebueigo.com/neo/usrctrl.php?mag_id=3
毎週1回、最新情報をお届けします。
セブのこと、タイのこと、英語学習、筋トレ、海外起業等。
+++++++++++++++++++++++++++++++++++++